
Business
Europe’s Ultra-Rich Expand Rapidly as Wealth Gap Remains Wide Across Continent


The number of ultra-wealthy individuals in Europe has grown sharply over the past five years, even as data continues to highlight deep inequality in wealth distribution across the continent.
According to Knight Frank’s Wealth Report 2026, Europe’s population of ultra-high-net-worth individuals—defined as those with at least $30 million in assets—has increased by 26 percent since 2021. The total has risen from 146,525 to 183,953, adding more than 37,000 individuals in five years.
This growth translates to an average of roughly 20 new ultra-wealthy individuals each day in Europe. Globally, the report shows around 89 people cross the $30 million threshold daily, underscoring a broader expansion of extreme wealth across major economies.
Despite this rise, wealth inequality within Europe remains pronounced. The European Central Bank reported in 2023 that the median net wealth of households in the euro area stood at €123,500. However, the distribution varies widely, ranging from just €2,000 among the bottom 20 percent of households to more than €1 million for the top 20 percent.
Germany leads Europe in the growth of ultra-wealthy residents. The number of individuals in the country with at least $30 million in wealth increased from 28,942 in 2021 to 38,215 in 2026. On average, this equates to about five new entrants per day. Germany remains Europe’s largest economy and ranks third globally in GDP after the United States and China.
Switzerland has also seen strong growth, adding an average of 2.7 ultra-wealthy individuals per day over the same period. France follows with around 2.1 new members daily, bringing its total to 21,518. The United Kingdom and Italy both record growth of approximately 1.6 individuals per day, while Spain adds about 1.5. Turkey also features among the faster-growing markets in Europe, with around 1.1 new ultra-wealthy individuals daily.
Smaller but steady increases are recorded across other European economies, including Poland, Czechia, Austria, Denmark, Portugal, the Netherlands, Ireland and Sweden, where growth ranges from 0.3 to 0.9 individuals per day.
On a global scale, the United States remains the dominant hub for extreme wealth, with 251,352 ultra-high-net-worth individuals in 2026. China follows with 121,677, while Germany ranks third worldwide. The United States alone adds an average of 36.7 new ultra-wealthy individuals daily, roughly one every 90 minutes. China adds about 12.5 per day.
India and Australia also appear among the top global contributors outside Europe. Overall, the global ultra-wealthy population increased by 162,191 between 2021 and 2026, reaching a total of 713,626 individuals.
Liam Bailey, global head of research at Knight Frank, said the trend reflects a major shift in global wealth distribution, with established and emerging economies both contributing to rapid growth in high-net-worth populations.
At the same time, UBS Global Wealth Report 2025 data highlights significant variation in average wealth per adult across Europe, ranging from about €29,923 in Turkey to €634,584 in Switzerland, reinforcing the continent’s persistent wealth divide despite rising numbers at the top end of the economic scale.
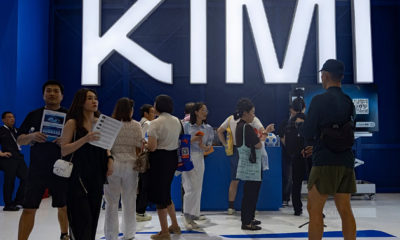





Chinese artificial intelligence start-up Moonshot AI is preparing for a possible Hong Kong stock market debut in early 2027 after its valuation rose to about $50 billion, while rival DeepSeek is attracting billions of dollars from investors in a new funding round.
Beijing-based Moonshot AI, the developer of the Kimi chatbot, completed its latest private fundraising at a valuation of about $50 billion, according to Bloomberg, which cited people familiar with the matter. The figure represents a sharp increase from the $31.5 billion valuation recorded during its previous funding round this summer.
The company is targeting the first quarter of 2027 for an initial public offering in Hong Kong that could raise as much as $5 billion, although the timing and size of the deal could change, the report said.
Moonshot has begun arranging meetings with potential investors to assess demand, possibly starting this month. Bank of America is coordinating the proposed offering, with China International Capital Corp, Deutsche Bank and Goldman Sachs serving as sponsors, according to Bloomberg.
The company has also reported rapid growth in recurring revenue. Its annual recurring revenue increased from about $300 million in June to roughly $1 billion and could reach $2 billion by December.
Moonshot was founded in early 2023 by Yang Zhilin, a Tsinghua University graduate who previously worked at Meta AI and Google Brain. The start-up is backed by major Chinese technology companies including Alibaba and Tencent. It attracted international attention after releasing its Kimi K3 open model in July.
A successful listing would make Moonshot one of the latest Chinese AI companies to seek capital in Hong Kong. Zhipu and MiniMax also listed there in January, with MiniMax shares more than doubling during their first trading session.
Meanwhile, Hangzhou-based DeepSeek is nearing completion of a much larger funding round. Bloomberg reported that the company is close to securing at least 80 billion yuan, or about $10.6 billion, with Tencent and battery manufacturer CATL among its biggest investors.
Heavy demand could lift the fundraising total to around 100 billion yuan, twice the roughly 50 billion yuan initially sought by the start-up. DeepSeek had reportedly been targeting a valuation of about 500 billion yuan for the round.
The company became a global technology sensation after its low-cost R1 model was released in January 2025, contributing to a sharp fall in Nvidia’s market value. DeepSeek has since released newer V4 models and introduced the faster V4.1-Flash version in September.
The company has also partnered with Huawei on programming tools for its Ascend AI chips as China seeks to reduce dependence on Nvidia technology.
Both Moonshot and DeepSeek are reportedly under investigation by China’s internet regulator over allegations concerning the handling of sensitive user data and the use of Anthropic’s Claude chatbot. The potential impact of the probe on their market plans remains uncertain.
DeepSeek has separately hired CITIC Securities to prepare for a possible listing on Shanghai’s STAR Market, although no timetable, valuation or offering size has been publicly confirmed.
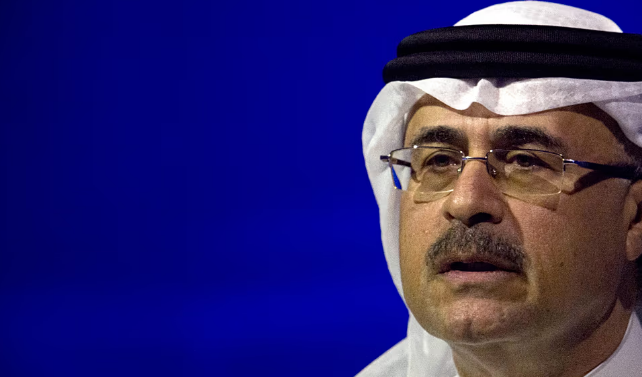
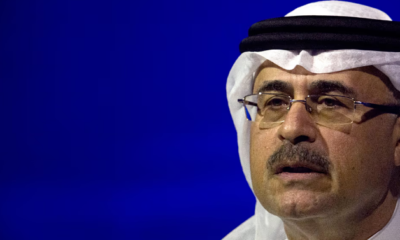
The global oil supply system is coming under increasing strain as the war involving Iran and disruptions around the Strait of Hormuz have depleted inventories, Saudi Aramco Chief Executive Amin Nasser said on Monday.
Speaking at the Energy Intelligence Forum in London, Nasser warned that the world has limited spare supply capacity to absorb additional disruptions. He said rebuilding global oil inventories after the crisis could take as long as two years, even after shipping through the Strait of Hormuz fully returns to normal.
The waterway normally carries about 20% of global oil and liquefied natural gas supplies. Its effective closure during the conflict has disrupted energy flows, pushed up prices and increased pressure on economies around the world.
Seven months into the war, the global stockpile system is “already straining,” Nasser told the conference, attended by senior figures from across the energy industry.
The Group of Seven countries, working with the International Energy Agency, agreed on Friday to release 100 million barrels of crude oil and diesel from emergency reserves in an effort to ease supply concerns.
Nasser said, however, that headline inventory figures can give a misleading impression of how much oil is actually available to the market. He estimated that less than 10% of reported reserves could be freely used, with much of the remainder needed to maintain the operation of energy infrastructure.
Global oil inventories were estimated at about 10 billion barrels when the crisis began, according to Nasser. Since then, almost 3 billion barrels of supply have been lost, representing about half of the crude and refined products that would normally have moved through Hormuz during the period.
More than 1 billion barrels have been taken from global inventories to compensate for those losses, primarily from commercial stocks held onshore. Nasser said remaining inventories of less than 6 billion barrels were largely unavailable for practical use.
He described stockpiles as a temporary measure that could help the market get through one winter but warned they cannot resolve longer-term supply and demand problems. Rebuilding those reserves could take up to two years once normal shipping resumes.
Despite the disruption, oil exports from the Middle East Gulf, excluding Iran, recovered to pre-war levels in September, maritime tracking firm Kpler said. At least 16.5 million barrels per day left the region between September 1 and 28, compared with a pre-war average of 16.5 million barrels per day.
Around 40% of those exports are now avoiding Hormuz, compared with 17% before the conflict. Saudi Arabia and the UAE have used pipelines and other routes to maintain shipments.
Nasser said Aramco was meeting customer demand through international storage and rapid repairs to damaged facilities. The company is also seeking additional export routes and overseas storage to reduce dependence on a single shipping corridor.
Saudi oil facilities have been targeted by Houthi forces in Yemen during the conflict, adding to concerns over the security of regional energy infrastructure.
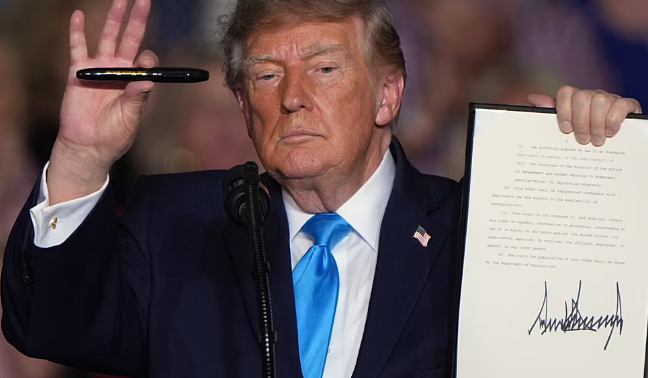
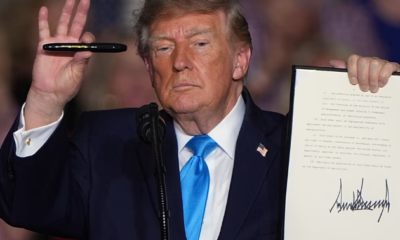
US President Donald Trump has signed an executive order deferring federal tax payments on red-dyed diesel used on public roads, as near-record fuel prices increase pressure on truckers, farmers and other diesel users ahead of next month’s midterm elections.
Trump signed the order on Monday during a campaign rally in Grand Island, Nebraska, where he was seeking to energize Republican voters.
The measure allows certain users to postpone payment of taxes on red-dyed diesel used on public roads between October 5 and December 31. The deferred taxes would not incur interest or penalties during the relief period.
Trump told supporters the order would waive the requirement restricting the fuel to off-road use and allow people to purchase tax-free dyed diesel for any purpose. However, the executive order itself does not immediately eliminate the tax.
The order directs Treasury Secretary Scott Bessent to explore ways, including possible legislation, to remove the obligation to pay the deferred amounts. Bessent has five days, in consultation with Secretary of War Pete Hegseth, to determine whether the legal conditions for the tax deferral have been met and identify eligible taxpayers.
If the administration does not cancel the tax, the deferred payments will remain due after December 31.
Red-dyed diesel is nearly identical to regular diesel but normally does not carry federal highway taxes because it is intended for off-road machinery such as farm equipment. Using it on public roads can normally result in penalties.
The federal diesel tax is 24.4 cents per gallon. The White House said that represents about $60 on a 250-gallon fill, with savings potentially exceeding $100 where states also adopt similar measures.
The average US diesel price stood at $6.32 a gallon on Monday, according to AAA, close to the record $6.53 reached on September 22 and more than 70% above its level a year earlier.
Fuel prices have surged since the Iran conflict began in February, disrupting shipping through the Strait of Hormuz. Russia’s reduction in fuel exports following Ukrainian attacks on refineries has added to supply pressure.
The White House attributed high prices to the Russia-Ukraine war, limited global refining capacity and policies in some Democratic-led states that reduced refinery operations.
Trump has also highlighted a G7 agreement to release 100 million barrels of refined diesel from strategic reserves over four months. The move followed his threat to restrict US diesel exports in response to elevated domestic prices.
Farm groups welcomed the tax relief as the harvest season gets underway.
“Every cent per gallon matters when you’re running a fleet of grain trucks or hauling cattle hundreds of miles,” said Zippy Duvall, president of the American Farm Bureau Federation.
Oil prices fell on Tuesday as Gulf crude exports excluding Iran recovered toward pre-war levels. Brent crude dropped below $100 a barrel in early trading, while US West Texas Intermediate crude fell about 2.5% to below $88.
The decline could provide some relief to US fuel consumers, although diesel prices remain close to record levels.

Moonshot AI Targets 2027 Hong Kong IPO as DeepSeek Funding Race Intensifies

Saudi Aramco Chief Warns Global Oil Supply Cushion Is Running Thin

Trump Defers Diesel Taxes as US Fuel Prices Near Record Highs

Investors Face Limited Choices as Robotics Boom Stays Locked in Private Markets

Optogenetics Pioneers Win 2026 Nobel Prize in Medicine

Iran Says Hormuz Can Reopen Within Seven Days as Oil Exports Come Under Pressure

Uruguay Tops Global Retirement Ranking as Europe Dominates Top 10

SpaceX crew reaches International Space Station in record US transit

Guirassy scores as Guinea edge Kenya in AFCON 2027 qualifier

Trump, Vance begin midterm campaign push as Republicans confront economic concerns

Meta Acquires Tilda Swinton VR Doc ‘Impulse: Playing With Reality’

China’s Historic Olympic Victory Sparks National Pride Amid Controversy

Saudi Arabia’s Model for Sustainable Aviation Practices

Recent Developments in Small Business Taxes

Effective Drain Cleaning: A Key to a Healthy Plumbing System

Who was Ebrahim Raisi and his status in Iranian Politics?

Keely Hodgkinson Wins Britain’s First Athletics Gold at Paris Olympics in 800m

Carrectly: Revolutionizing Car Care in Chicago

Nobel Laureate Muhammad Yunus Proposed as Head of Bangladesh’s Interim Government Following Hasina’s Resignation

Chinese Hackers Infiltrate Major U.S. Telecom Firms in Possible National Security Breach

Sony WF-10XM4: Headphones Are Our Absolute Favorite

10 Places You Can’t Miss If It’s Your First Time in European

New Census Data Will Shake Up Alabama Politics

16 Top of Our Favorite Outdoor Clothing Brands

Fashionable Summer Accessories to Dress Up Your Travel Look

How Sleeping Less than 7 Hours a Night Can Lead to Weight Gain
-
 Entertainment2 years ago
Meta Acquires Tilda Swinton VR Doc ‘Impulse: Playing With Reality’
-
 Sports2 years ago
China’s Historic Olympic Victory Sparks National Pride Amid Controversy
-
 Business2 years ago
Saudi Arabia’s Model for Sustainable Aviation Practices
-
 Business2 years ago
Recent Developments in Small Business Taxes
-
 Home Improvement2 years ago
Effective Drain Cleaning: A Key to a Healthy Plumbing System
-
 Politics2 years ago
Who was Ebrahim Raisi and his status in Iranian Politics?
-
 Sports2 years ago
Keely Hodgkinson Wins Britain’s First Athletics Gold at Paris Olympics in 800m
-
 Business2 years ago
Carrectly: Revolutionizing Car Care in Chicago